Models
To try and make some sense of what I had discovered in interviews and secondary research, I made a series of models of the attention system.
Concept Maps
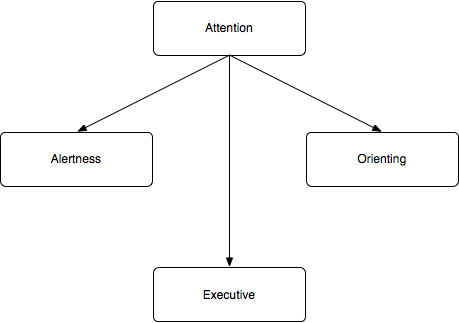
To start, I tried to tie in some of the more formal definitions of attention that I had seen in journals, especially Posner’s model of attention. This model is based on three subsystems of attention: alertness, orienting, and executive.
Posner and Petersen. "The attention system of the human brain." Annual Review of Neuroscience.
Then I tried to form what I had learned about attention into a simple model. This turned out to be entirely wrong:
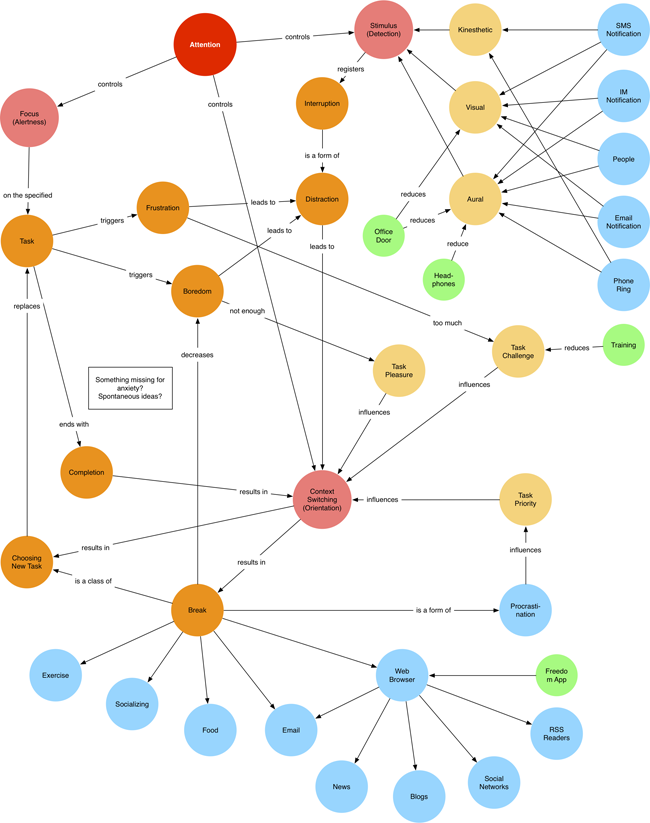
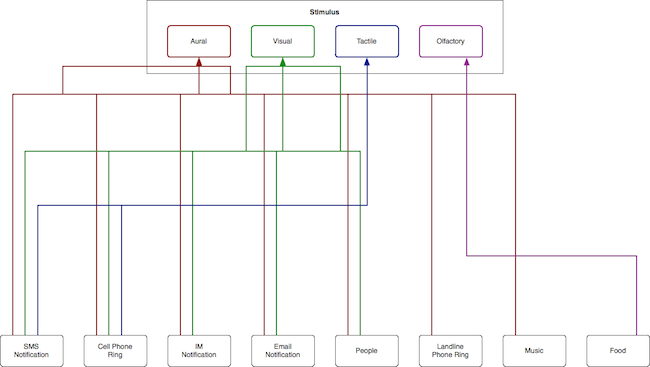
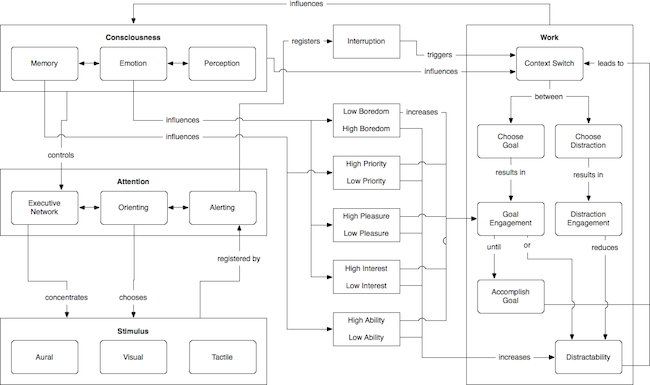
Next, I made a broader concept map that included some of the common causes of distraction and the feelings and stimuli associated with them:
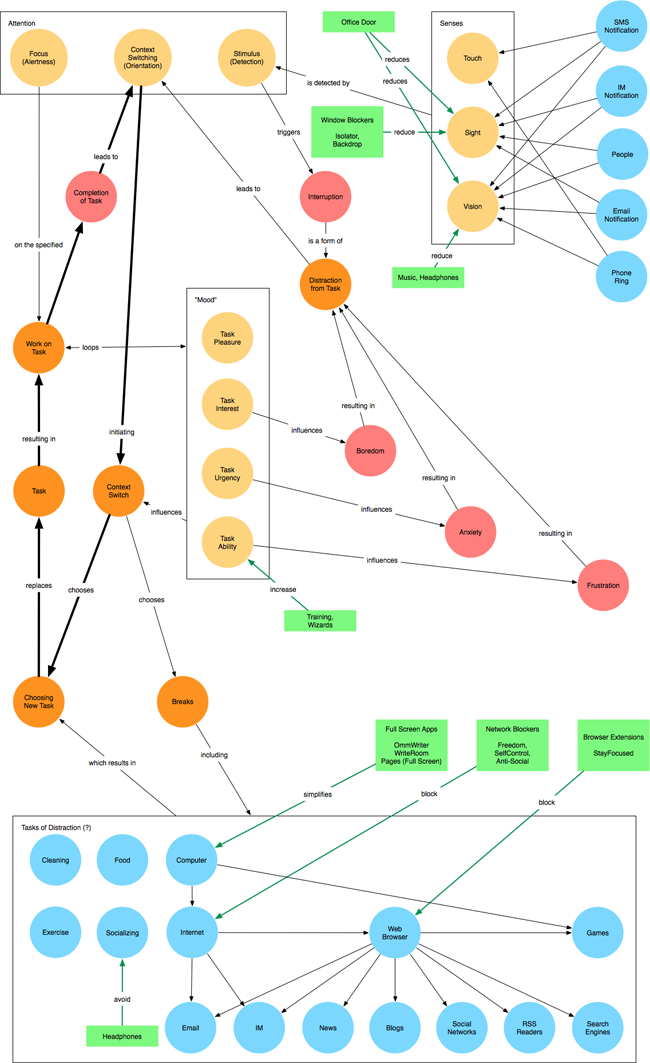
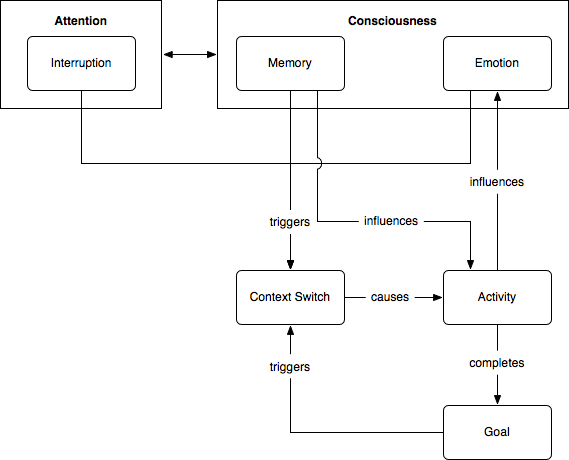
I did another few rounds of iteration on this model. I added the concepts of “consciousness” as a higher level in my concept map, and here was the result:
Simplifying
Though still in progress, the model had already started to get out of hand. It was too complex. I decided to simplify.
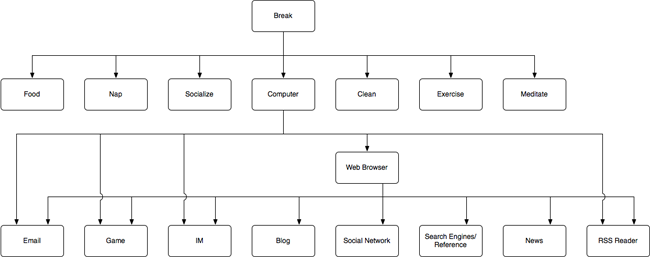
I started to break out some of the pieces of my larger concept map so that the map wasn’t quite so daunting. I broke the lower part out into its own diagram so that it would more clearly show what kinds of things people like to do when they get distracted or take a break.
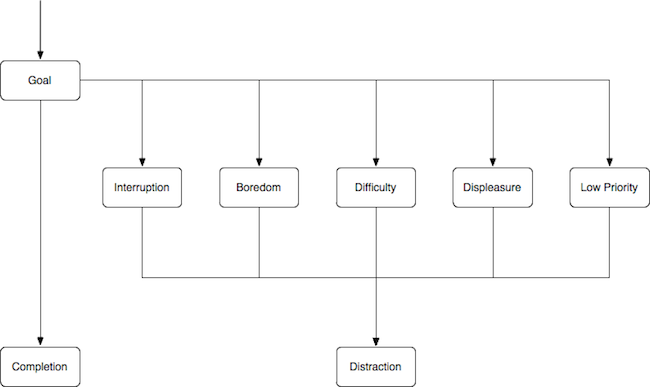
Next, I broke out the piece of the diagram that shows what I identified in my interviews as the root feelings of distraction.
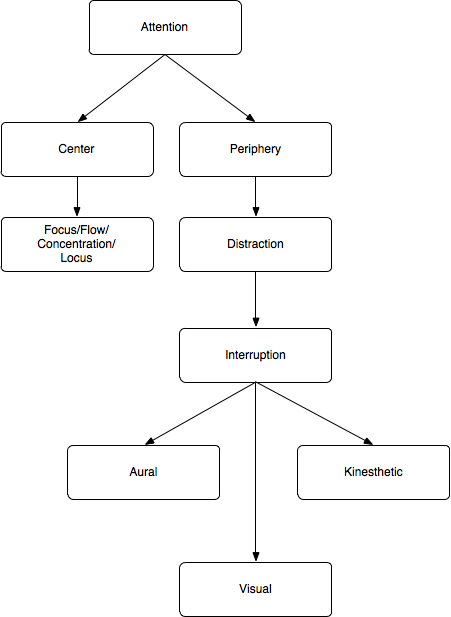
I also broke out the diagram for interruption. In the process of documenting it, I determined that interruption did not fall under the area that I was interested in exploring for the project. I also figured out that, taxonomically, interruption is one form of distraction that is highly preventable. Rather than building notification systems to deal with the increased quantity of interruptions, designers should more carefully consider whether their notification is worthy of a user interruption.
Another core piece of the concept map that I was working with was the idea of a work loop, where people work on one thing until distraction pulls them away or they reach a context switch, where the easiest option is to choose a distraction. Here’s the simplest form of it.
Thresholds
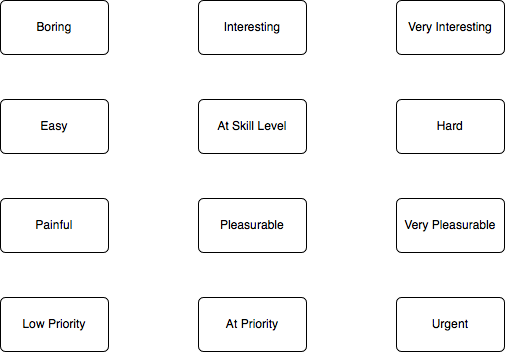
I also started playing around with the idea of thresholds of different emotions. In the emotion diagram above, for instance, I use boredom, difficulty, pleasure, urgency (priority), and ability as the key emotions having to do with distraction and flow. This model puts those emotions in a matrix where different outcomes can be plotted using the different words.
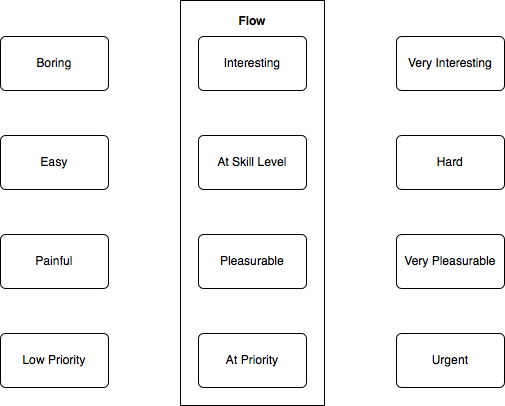
For instance, you could express flow this way:
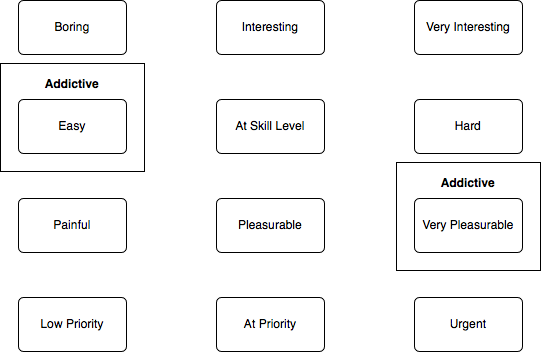
Or addiction this way:
Or frustration this way:
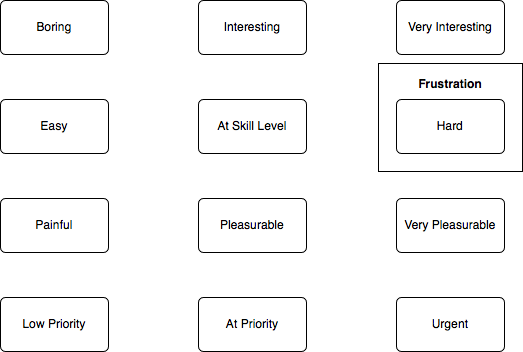
This model never quite got past half baked, but it was a good exercise to see how the different emotions relate.
Complex
After the experiment, I went back and redid my concept map as a flow chart that ties these emotions more closely together with the work loop and the levels of consciousness that I identified above:
I worked with Paul to review this last model and a few of the earlier ones, and he suggested that it’s still a bit unclear as to what exactly it is: concept map, flow chart, or what. The box in the lower right of the model, labeled “Distractability,” is neither a step in a flow chart or an emotion in a concept map. So this still wasn’t quite right.
A Different Direction
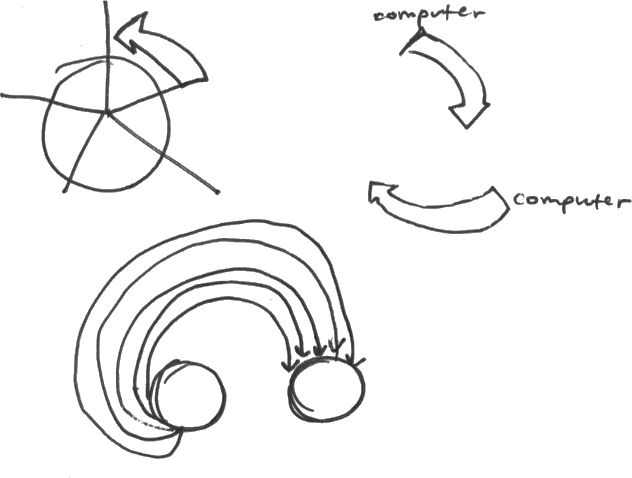
Paul suggested that I take the core concept of this chart — emotions pulling you towards or pushing you away from work — and distill that out. He helped me work out a sketch for that distilled model:
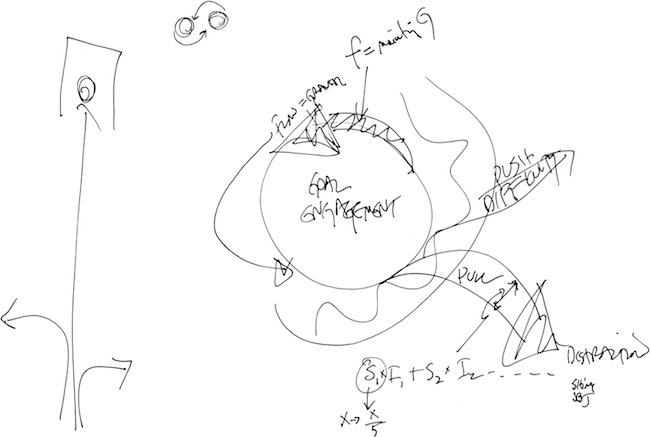
In this sketch by Paul, the emotions are quite literally orbiting around the goal engagement, and distraction are the things that pull you out of orbit.
I did a few more iterations on these sketches.
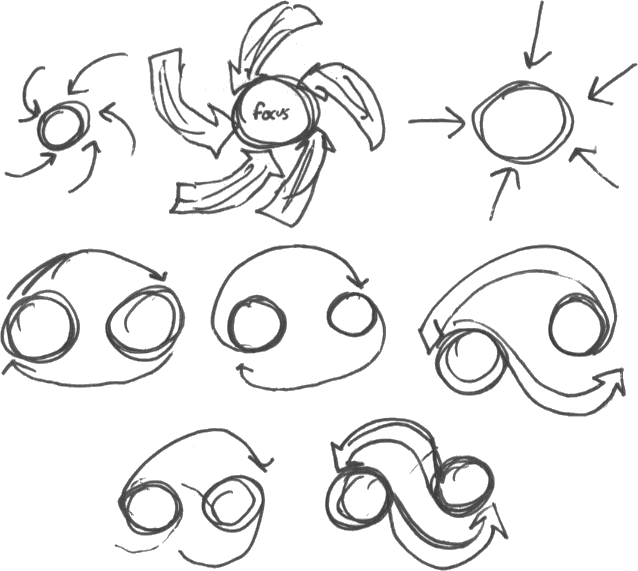
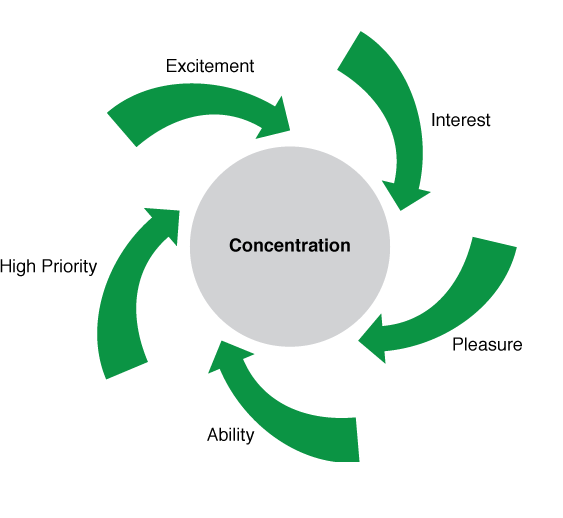
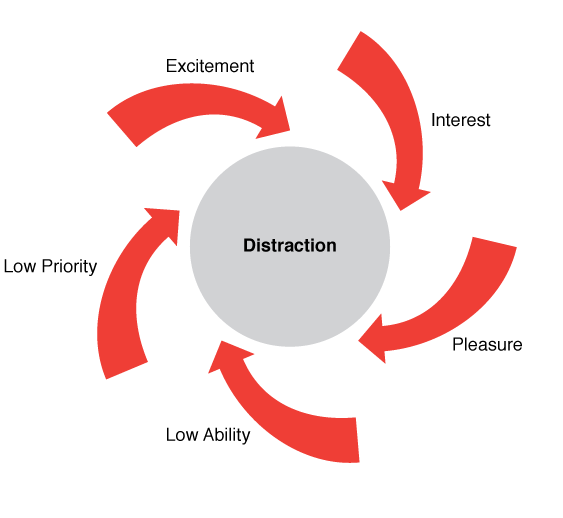
After sketching, I was ready to model the subject again. I took the five primary emotions from my last model: excitement (previously boredom), interest, pleasure, priority, and ability, and showed them as forces influencing your concentration. The idea is that they were pulling or pushing you into concentration.
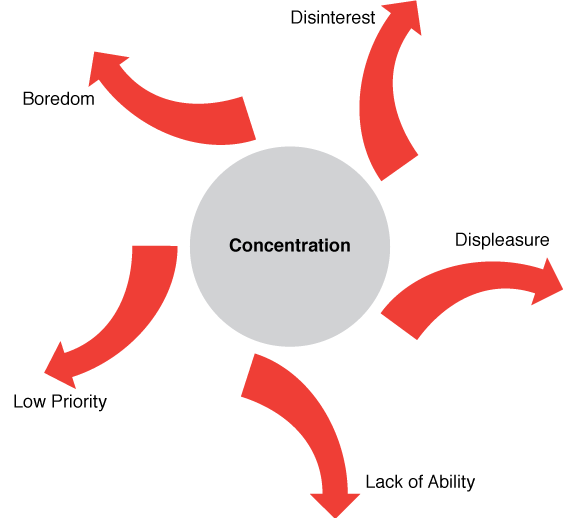
You could also “invert” the diagram so that those same emotions are pushing/pulling you away from concentration into distraction.
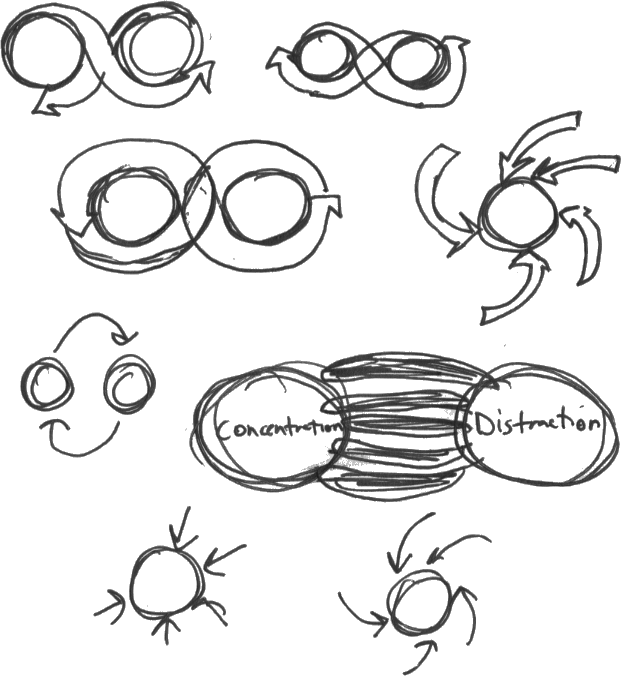
But you also invert it a bit more (if that even makes sense) so that rather than pushed away from concentration, you’re being pulled toward a distraction.
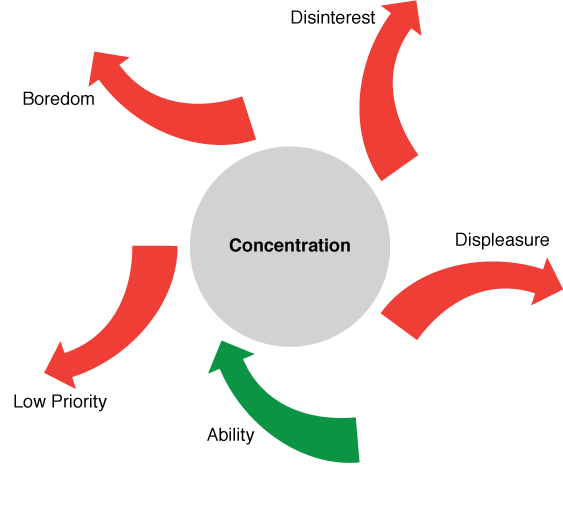
The idea with this would be that you could adjust the arrows as necessary to show what the active influences are. For instance, if you had a training program or a wizard to guide you through a process, it would increase your ability but would not affect the other aspects.
The concepts were all in place, but the diagram still was too complex. I took one more pass before I landed on my final model.
Copyright © 2010 - 2011 Eric St. Onge
Please send questions or comments to eric at ericstonge dot com.