Side Project
Historygram: A Safari extension that visualizes browsing habits
During the initial research portion of the thesis project, I decided that I wanted to perform a diary study of how people use their web browsers. I wanted to test my hypothesis that people spent a significant amount of their time repeatedly visiting the same website over the course of the day. I discovered that an extension for a web browser (such as Safari, Chrome, or Firefox) could be a valuable tool for gathering some of the data I was looking for.
After my initial interviews, I did not determine whether my hypothesis was correct or not, but I did determine that the answer to the question was immaterial to the outcome of my thesis project. The results of my interviews taught me that regardless of whether people are visiting the same website or not, the important thing is that people are distracting themselves with things they know they should not be doing. The quantity of activity doesn’t matter as much as the character of the activity.
Regardless, I saw the opportunity to build the extension as a risk-free and relatively easy way of prototyping some of the concepts in my thesis. But, rather than focusing on time, I would focus on the number of visits to each website.
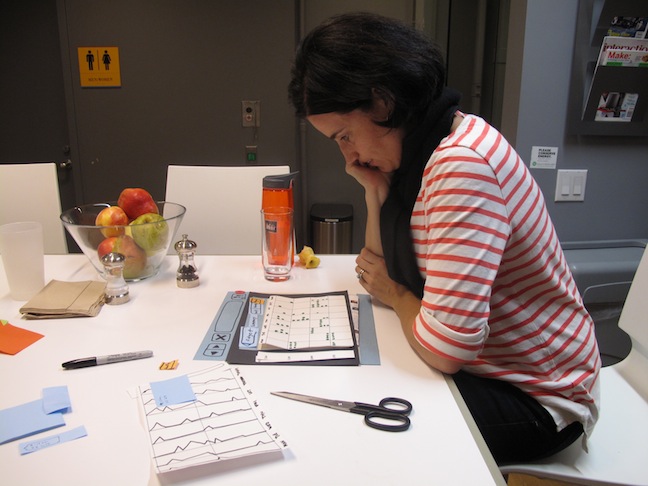
At first, I started sketching wireframes to get some ideas of how to answer these questions.
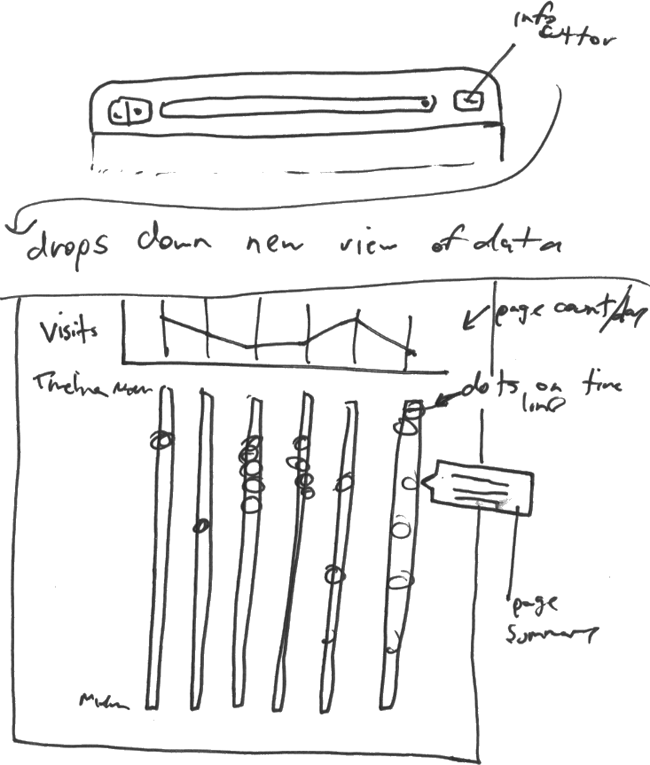
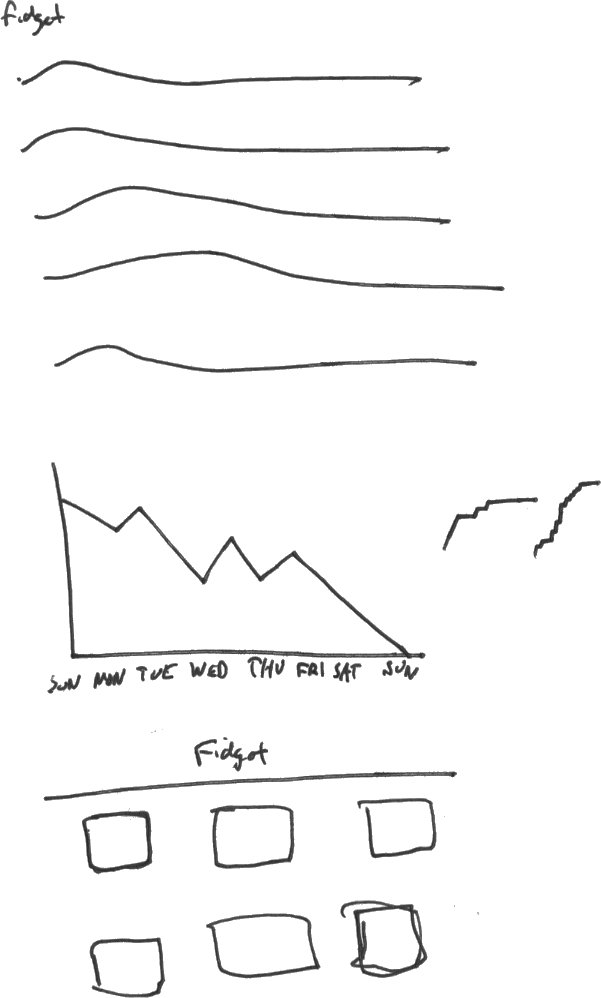
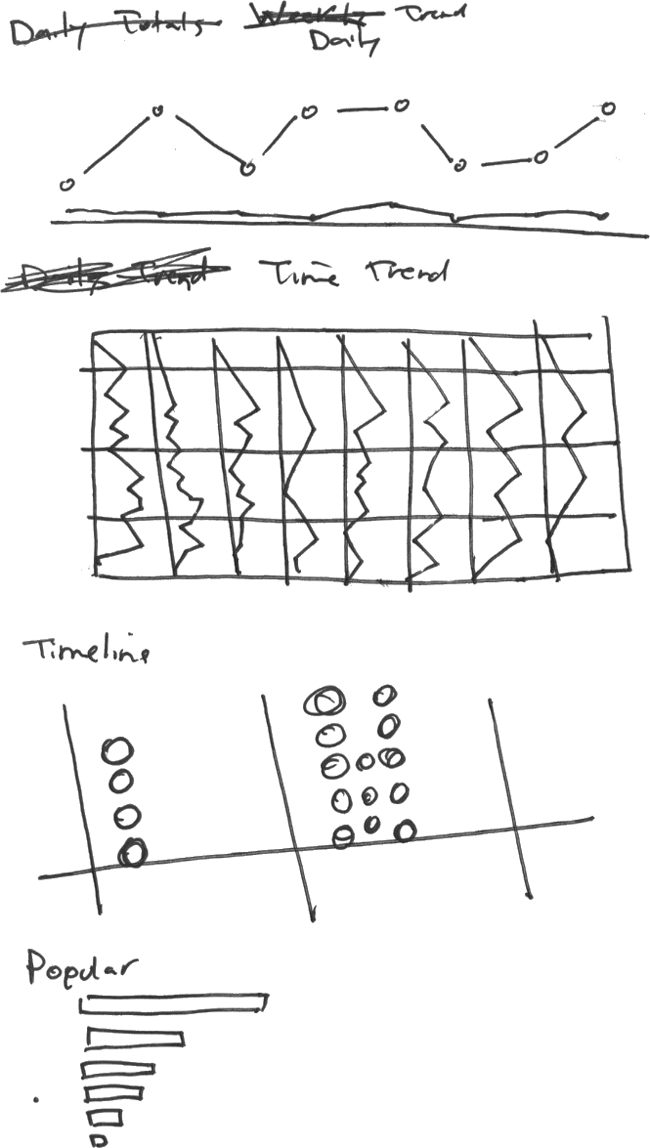
I created a paper prototype of some of my wireframes, and did a bit of user testing to get a sense of how the interaction would work.
Based on the user testing, I refined the design to focus on four core questions:
- How many times have I visited this site today?
- How many sites have I visited today?
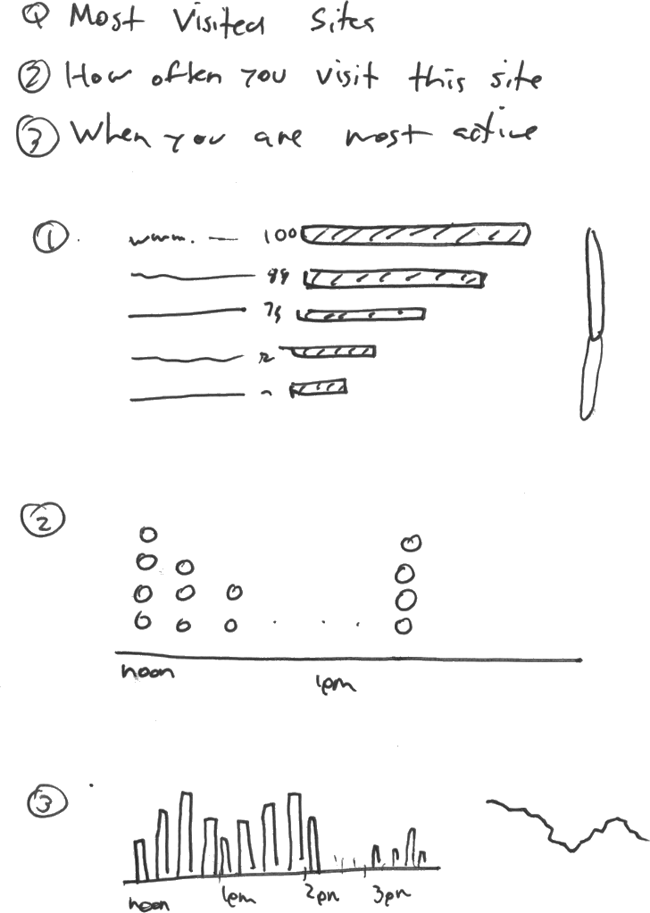
- What sites do I visit most frequently?
- When am I most actively visiting sites?
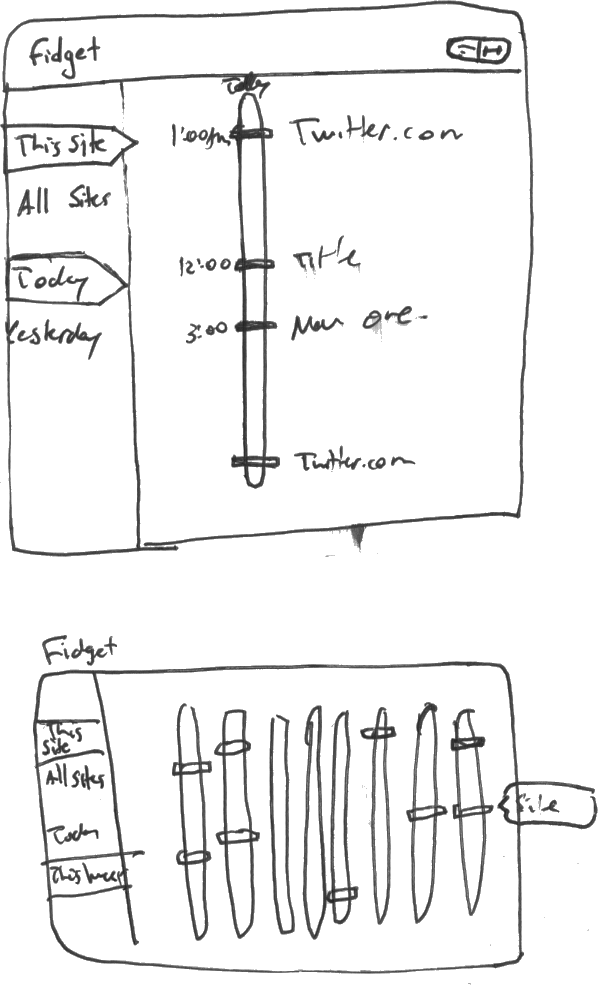
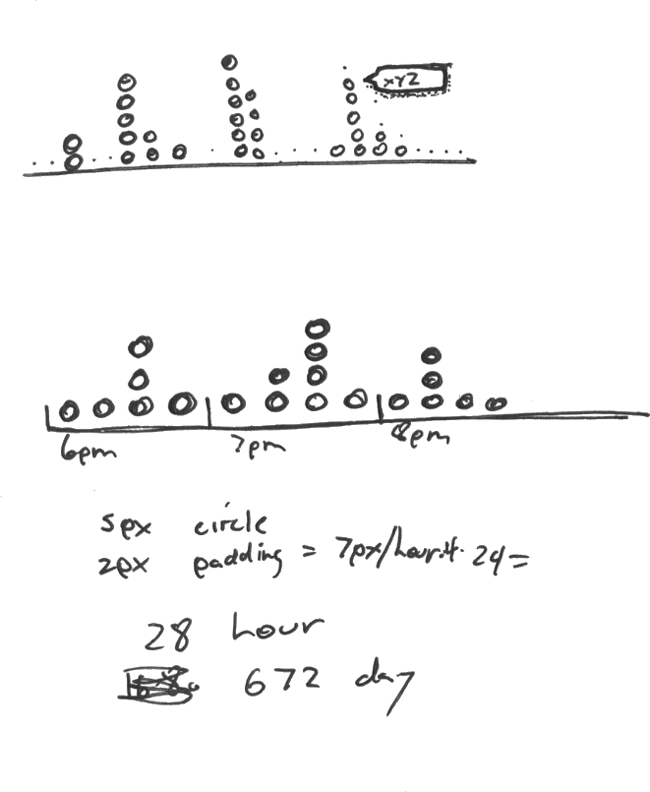
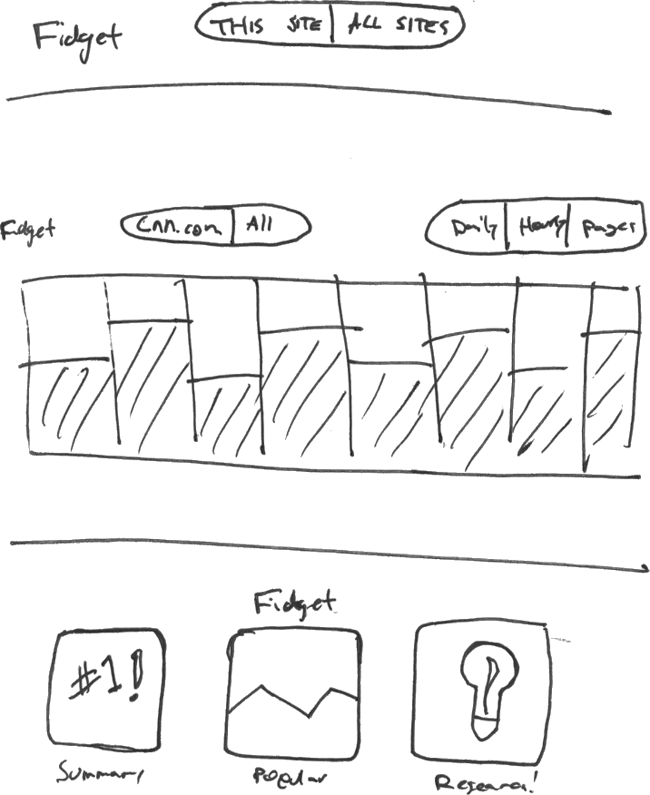
Then, I did some more sketching to design an interface that would directly answer those questions.
At that point, I jumped into the code and started building the extension. Over the course of the next few times, I used my free time to make small, incremental additions to the extension.

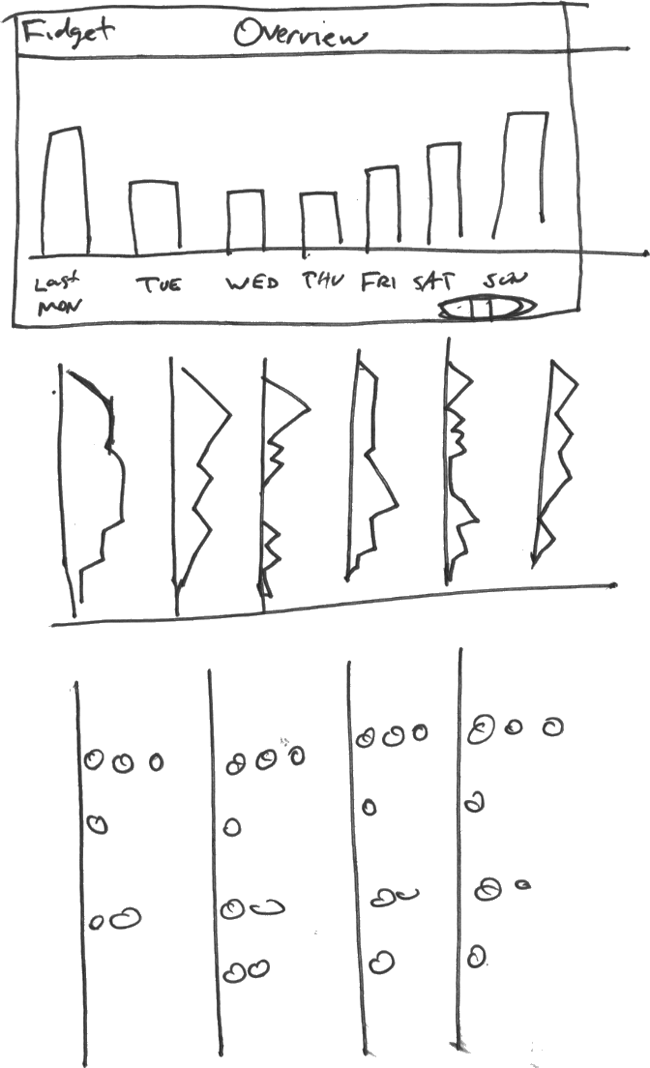
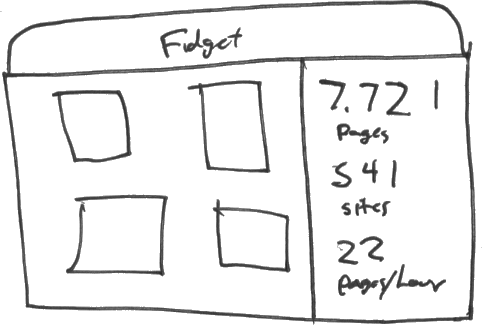
The final extension has four primary screens.
Toolbar Badge. The badge on the toolbar icon shows the total number of times you have visited the current site today. Press the toolbar button to open a more detailed view.

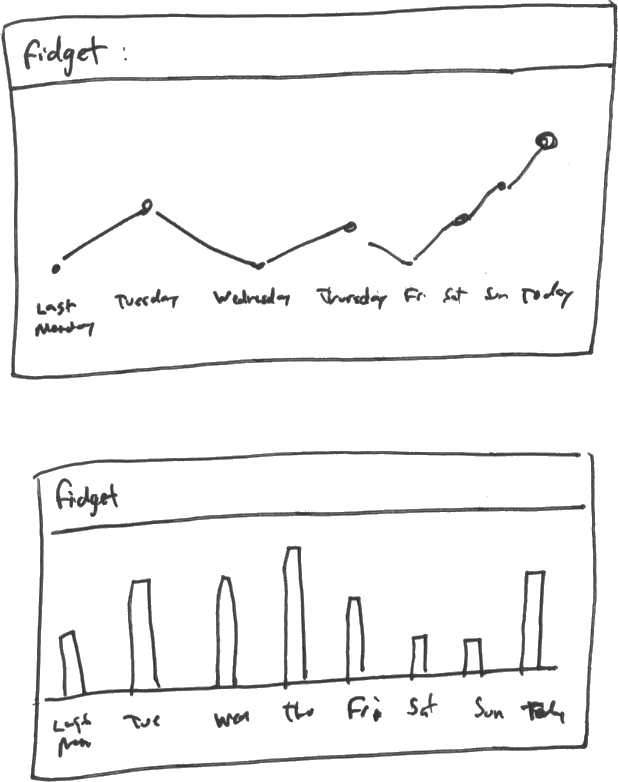
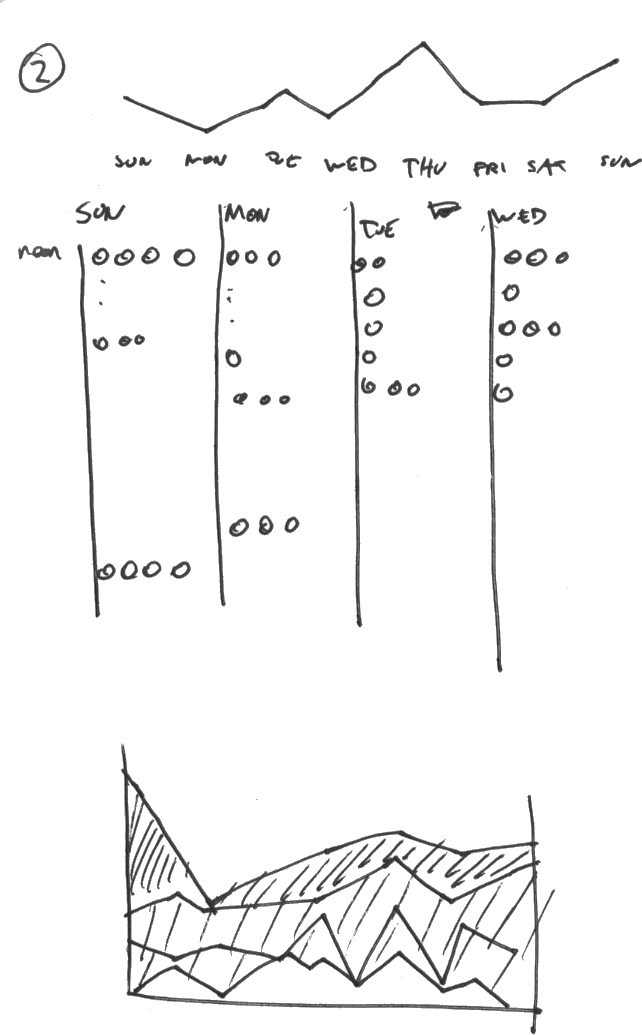
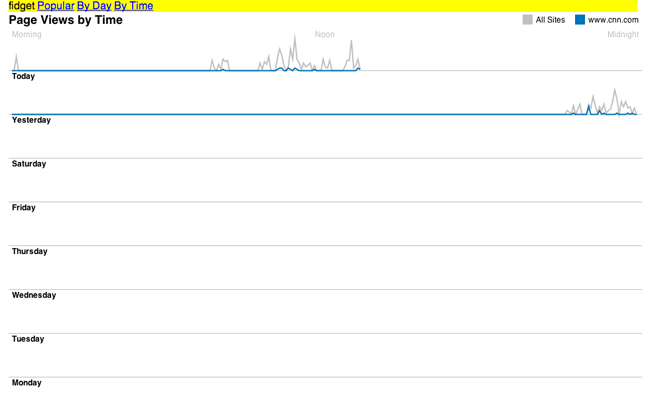
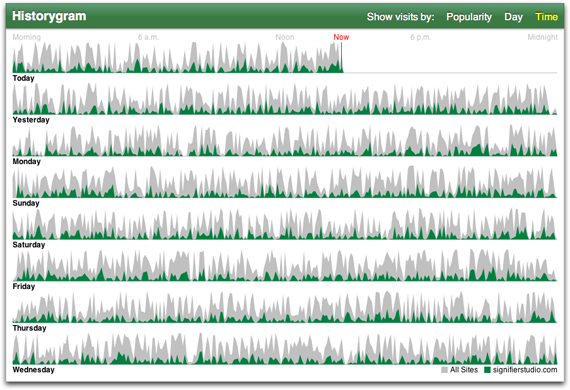
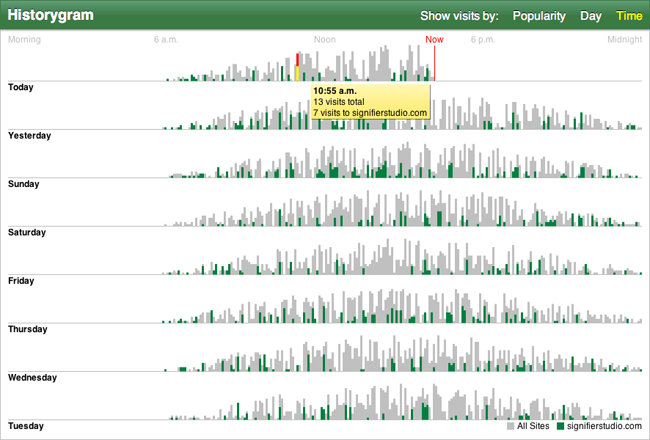
Time. The time view shows how many pages you've viewed during every 5 minute interval over the past eight days. The current site is marked in green, and every other site is marked in grey. Move your mouse cursor over the chart for precise numbers.
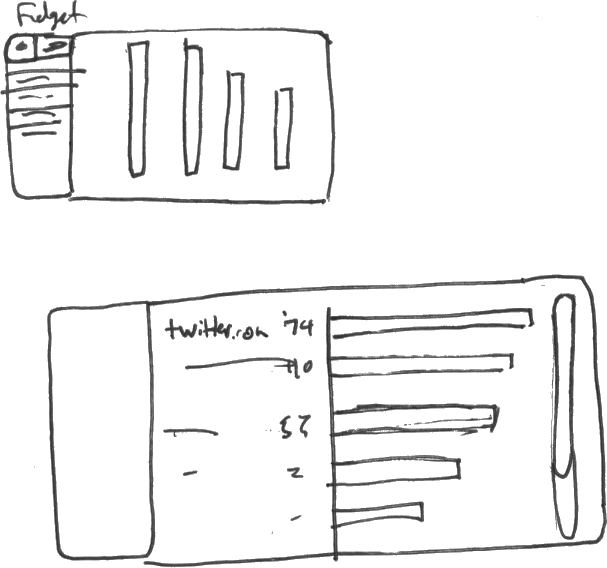
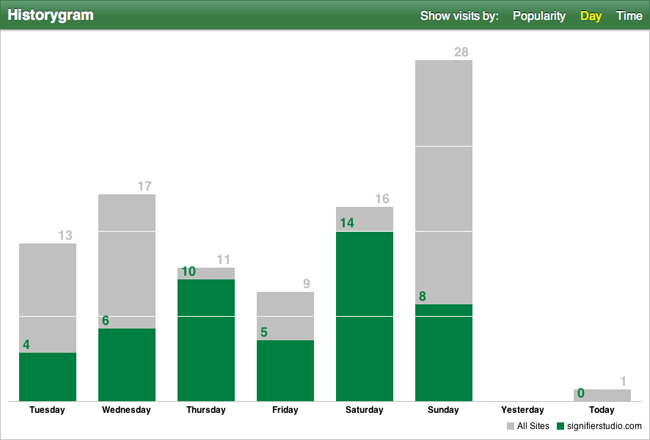
Day. The Day view shows the total number of pages you have viewed over the past eight days. The total for the current site is marked in green, and every other site is marked in grey.
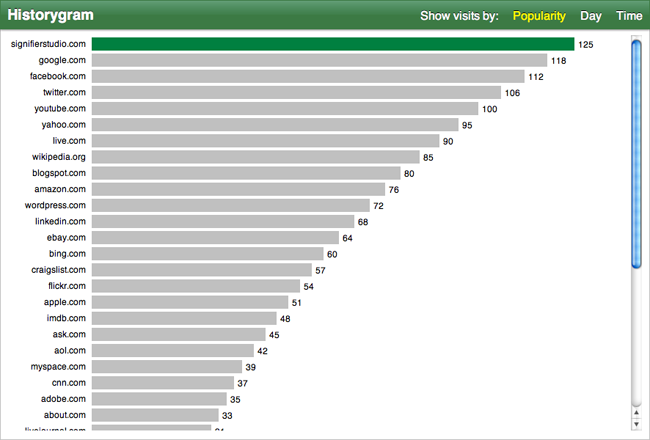
Popularity. The Popularity view shows you the sites you have visited most often over the past eight days.
Historygram for Safari was released in February. It is currently available for download.
Copyright © 2010 - 2011 Eric St. Onge
Please send questions or comments to eric at ericstonge dot com.